-1.png?width=100&height=95&name=logo%20(1)-1.png)
Administrators at district and school levels can easily track students' advancements and monitor how teachers and students engage with the curriculum through Ori's Progress and Usage Dashboards.
- The progress section emphasizes student development and tracks their progress with the assigned courses.
- The usage section provides insights into the frequency of teacher and student logins to Ori on a weekly/monthly basis, as well as the amount of time spent engaging with the platform.
Administrators have the ability to filter the data by Site (School), Class, Course, and time period to gain a more in-depth understanding of the information. Site admins will specifically view the data linked to their site/s.
The progress section showcases:
- The average scores of both pre- and post-assessments, the total number of observations considered for each average score, and the difference in points between the pre-assessment average and the post-assessment average.
- Student distribution across progress categories and average scores from pre- and post-assessments, along with graphs, can be analyzed for different timeframes and courses offered.

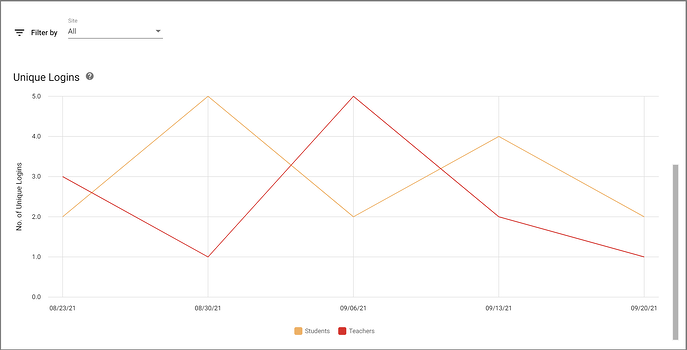
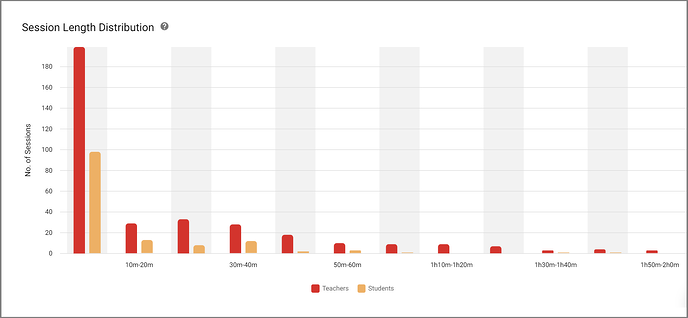
Insights into usage include:
- The amount of teachers and students accessing Ori on a weekly/monthly basis within the specified time frame.
- The duration of time that users dedicated to utilizing Ori during the specified timeframe.